Healing the World, Block by Block
UW–Madison researchers are helping to improve your health, wherever you live.
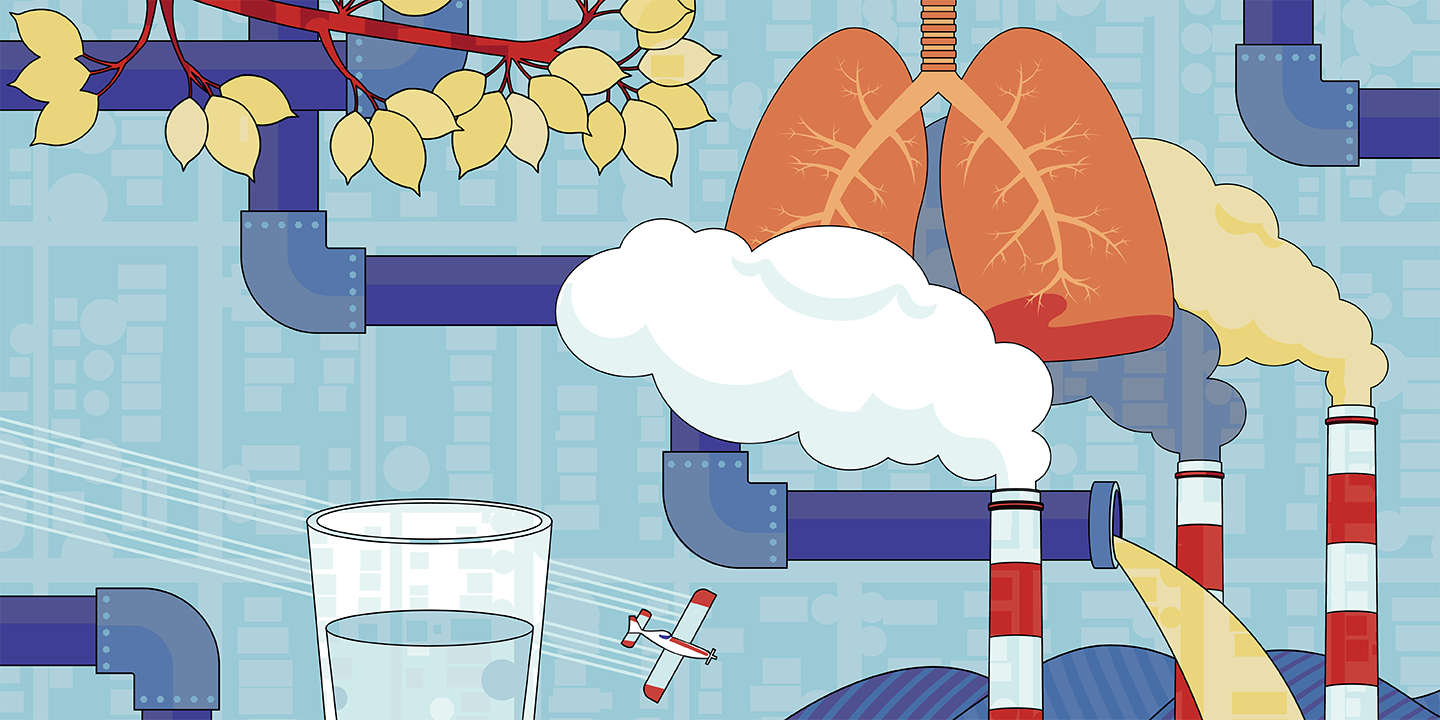
You are what you … drink? In Milwaukee, tens of thousands of households still receive drinking water through lead service lines. The pipes were installed in the 19th century and early 20th century, before medical research made clear that even a small amount of lead is toxic, particularly for small children.
Like many cities in the United States, Milwaukee faces complicated decisions about how to prioritize the replacement of lead pipes. That’s where a powerful tool built by researchers at the University of Wisconsin–Madison has become indispensable.
The Area Deprivation Index, or ADI, connects millions of data points related to employment, education, income, and housing quality to U.S. Census data to provide a user-friendly map of American neighborhoods ranked by their relative advantage — or disadvantage. The free online tool helps hundreds of organizations like Milwaukee Water Works target their limited resources in addressing public health challenges.
The ADI is a project of the Center for Health Disparities Research, a federally funded program at UW–Madison that promises to improve policy decisions and transform how health care is delivered across the nation. The center’s researchers are also hard at work untangling the complex reasons why people in more disadvantaged areas tend to be sicker and die earlier.
The Air You Breathe
The principle underpinning the Area Deprivation Index is that people’s health is determined not just by their genes but also the environments where they live and work.
“It’s the whole nature-versus-nurture idea — and the real answer is that it is both,” says Amy Kind ’96, MD’01, PhD’11, a geriatrician in the UW School of Medicine and Public Health and director of the Center for Health Disparities Research.
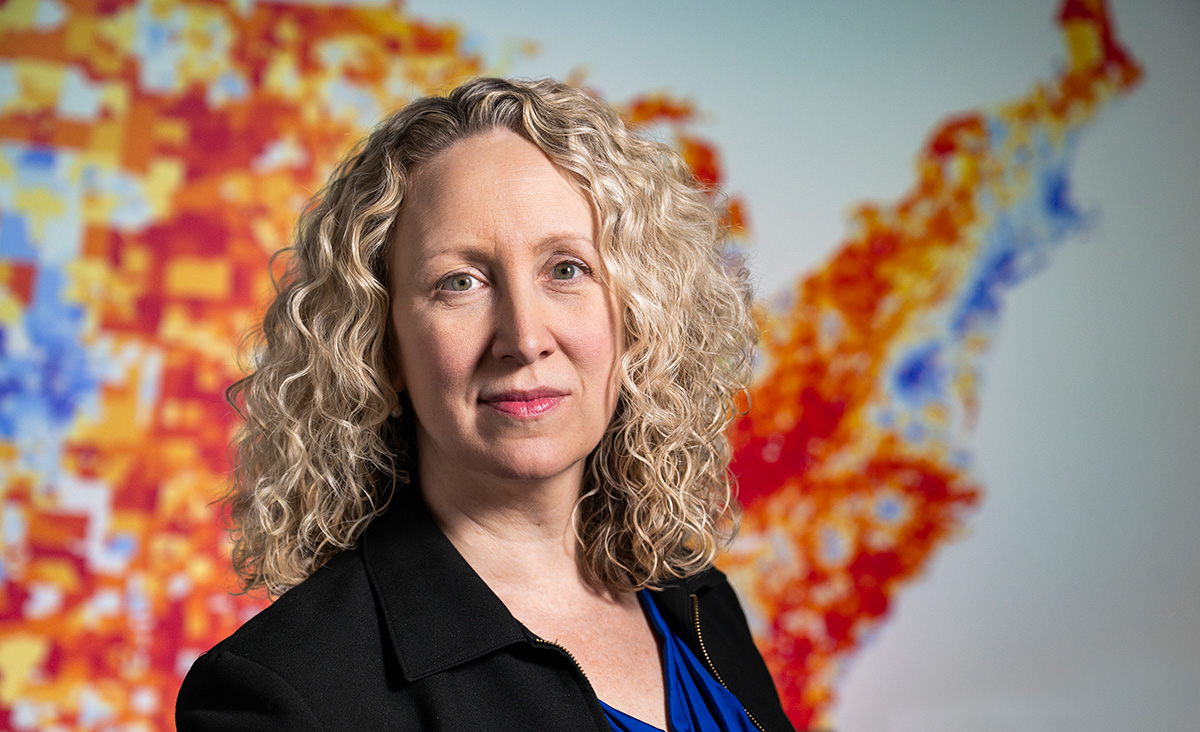
Kind and her fellow researchers are untangling the complex reasons why people in more disadvantaged areas tend to be sicker and die earlier. Taylor Wolfram
Founded in 2021, the center houses an interdisciplinary team of researchers. Its aim is to better understand how people’s unique circumstances and environments affect their health and to improve policy and health care decisions based on those findings.
“We know that diseases like Alzheimer’s and cancer are partly determined by your genetics, but a whole bunch of it isn’t,” says Kind. “Things like your lifestyle, the air you breathe, and the world around you play a huge role.”
While residents in urban neighborhoods face challenges like noise that disrupts their sleep and more days of poor air quality, Kind points out that rural life can carry its own health risks — ones that she herself may have been exposed to during her childhood deep in the Northwoods of Wisconsin in the tiny village of Niagara.
“Depending on where you live or where you grew up, you might be exposed to toxins like arsenic from your well water or pesticides from farms,” she says.
Ultimately, everyone deals with certain environmental health risks, but those who live in so-called high-ADI areas contend with more risks or more serious ones.
The Center for Health Disparities Research, also known as CHDR (pronounced “cheddar” — this is Wisconsin, after all), specializes in the social factors that influence human health and disease, including transportation access, pollution exposure, and food security.
The Center for Health Disparities Research promises to improve policy decisions and transform how health care is delivered.
CHDR has become the nation’s premier center for the study of these social factors. After years of combing through reams of public data with critical funding support from the National Institutes of Health, Kind and her colleagues published their first version of the Area Deprivation Index in 2014. It has since been updated and refined as new census data becomes available and is now the most commonly used measure of such social factors in the U.S. The ADI has thousands of users, from health care industry giants to tiny nonprofits to federal agencies such as the Department of Defense.
Available to anyone with access to the internet, the Area Deprivation Index has become a go-to resource for researchers, policymakers, and health care practitioners, some of whom stumble upon it while trying to make sense of patterns they see among their patients or within their communities. And the applications they’ve found for it have been extraordinary.
“A Very Useful Tool”
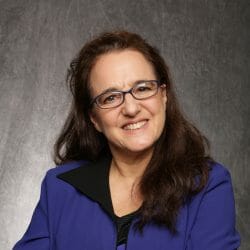
One such user is Shauna Lively, a nurse and project director for the West Virginia Perinatal Partnership. The organization’s mission is to improve health outcomes in the state for expecting and new mothers and their babies.
“I’m not super technically sophisticated, but I do know how to Google,” says Lively, who found the Area Deprivation Index while searching online for a tool that could help explain social drivers of health in West Virginia for a course she was teaching.
While Lively knew from experience that the state’s poorer and more rural communities had health care challenges, she says the ADI showed this relationship in a clearer and more detailed way than she had seen before.
“Looking at that map really helped me explain some of the issues we have in the state with maternity care and access to care,” says Lively.
People’s health is determined not just by their genes but also the environments where they live and work.
She then used the Area Deprivation Index to make the case for funding to improve access to health care providers in central West Virginia, where poverty and remoteness have long been barriers to quality health care. The West Virginia Perinatal Partnership was awarded a grant in 2021 and has since employed the ADI to prioritize maternal care resources in an eight-county region with historically poor perinatal health outcomes.
“We’ve found the ADI to be a very useful tool in trying to understand where we are with resources, or lack thereof,” says Lively. “We’re using it to see where we can target our outreach. We have so much appreciation for the folks who built the tool — I think it was very forward-thinking.”
The ADI’s uses are as varied as the health challenges its users are trying to address. Researchers have incorporated it into an algorithm for targeting neighborhoods in Chicago for rat extermination. The U.S. Social Security Administration uses the ADI to better understand the relationship between socioeconomic deprivation and participation in its child supplemental income program. The University of Texas Southwestern Medical Center in Dallas has used it to assess pediatric airway surgery patients for additional interventions.
And then there are the lead lines in Milwaukee.
A Eureka Moment
The Milwaukee water utility began incorporating the Area Deprivation Index into its strategy for replacing lead lines in 2024. That followed guidance from the U.S. Environmental Protection Agency and Wisconsin Department of Natural Resources that municipalities should include disadvantaged neighborhoods in their criteria for prioritizing replacement work.
Patrick Pauly, superintendent of Milwaukee Water Works, recalls learning about the Area Deprivation Index as a eureka moment. He was attending a conference for water utility professionals, and representatives of the Washington, DC, utility described how they were incorporating the ADI into their strategy for replacing lead lines.
“So we did some research, and the ADI provided exactly what we needed,” says Pauly.
That’s because its scoring system is simple and intuitive and based on factors the city needed to account for, including housing, income, and education level. Built around census blocks, the Area Deprivation Index is also granular enough to provide actionable information about individual neighborhoods.
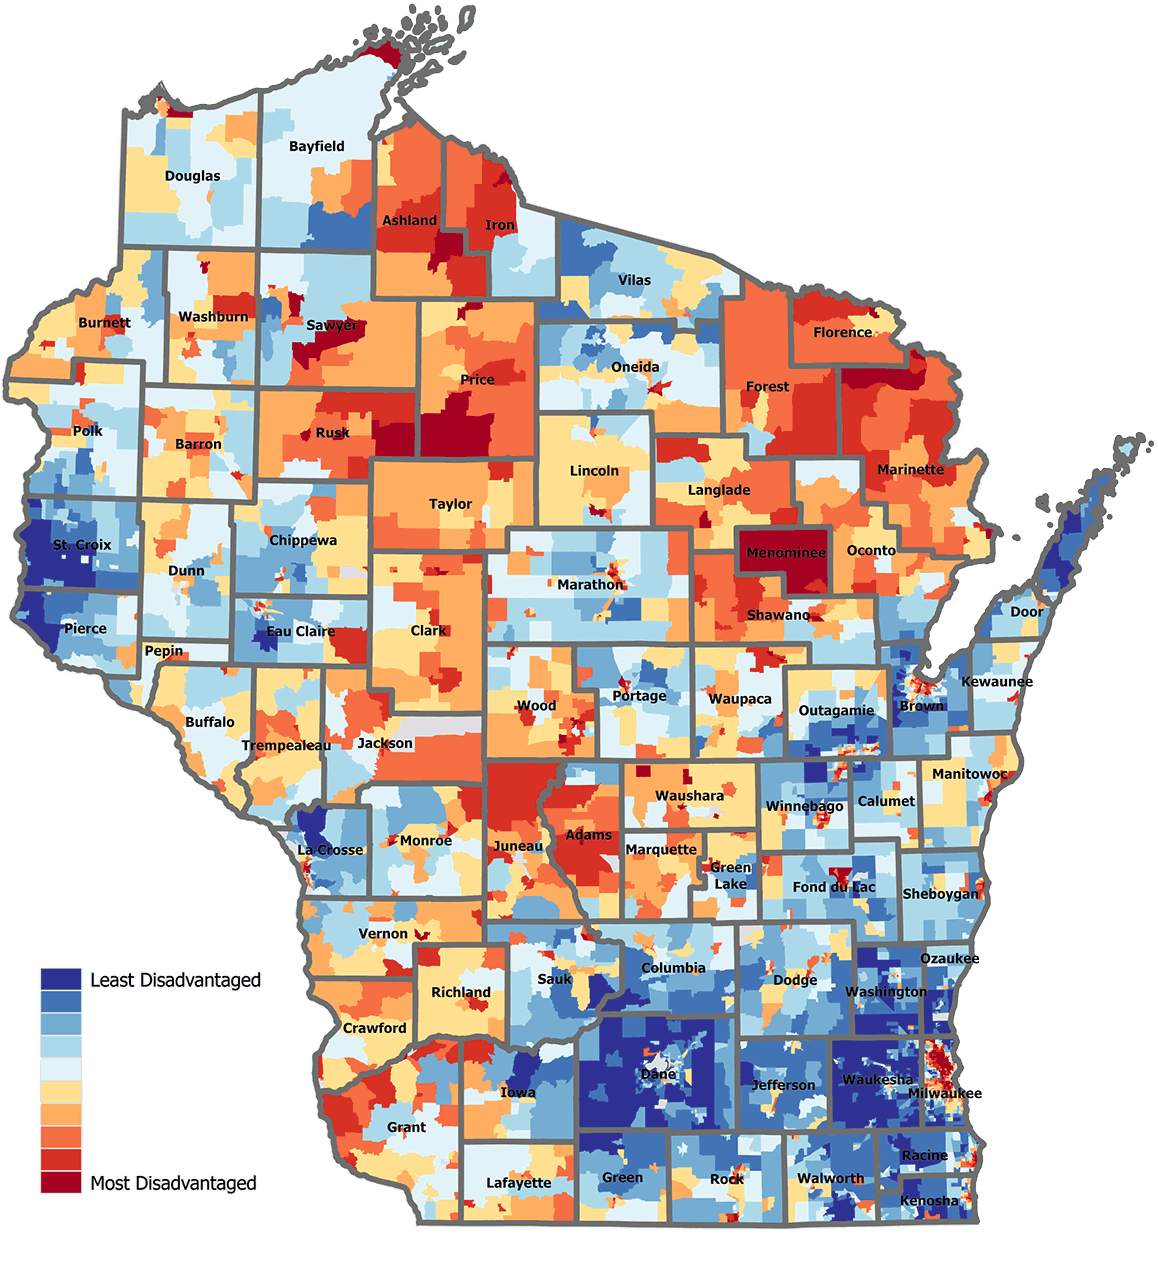
The Area Deprivation Index connects millions of data points to provide user-friendly maps of American neighborhoods ranked by their relative advantage or disadvantage. Will Buckingham
The ADI came into play as the utility worked with the city’s elected officials to change an ordinance that had previously required property owners to share the cost of replacing lead service lines — a prospect that was simply unrealistic in neighborhoods riddled with the old pipes.
In addition to changing that ordinance, the city adopted a new prioritization system built largely around the Area Deprivation Index. It significantly expanded the replacement program from around 1,100 replacements in 2023 to a goal of 5,000 in 2026 and beyond. The primary benefit of the ADI, Pauly says, is that it provides an evidence-based approach to expanding replacement work from individual homes to entire neighborhoods.
“Coming from the UW School of Medicine and Public Health and being online where people can look it up made the conversations so much easier,” says Pauly. “It was a very trusted, respected, simple, and easily explained method that provided us a huge benefit.”
While the Area Deprivation Index shows where deprivation can worsen health risks, scientists at the Center for Health Disparities Research are also hard at work to understand how social factors interact with biology to cause disease.
Writing Your Future
Kind says that living in adverse environments actually gets under the skin and leads to worse health.
“A lot of the work that goes on at CHDR is trying to figure out why that happens, and then how we can change it.”
These questions have opened doors to innovative studies, particularly in understanding the aging brain and how social factors affect the risk for neurodegenerative diseases such as Alzheimer’s. CHDR is leading a $38 million national study, funded by the National Institutes of Health, to examine how lifelong social exposures shape the brain.
“One of the interesting things about the brain is it interacts with the environment like no other organ,” says Kind.
Scientists at 23 sites across the U.S. begin with tissue from individuals who donated their brains to research after their deaths. Some of the samples go as far back as the 1980s.
A team of historians pieces together each person’s life history through obituaries, military records, and census records, back to the point of birth.
“We can connect an entire lifetime of experiences to where they’ve lived and then link that to exposures,” says Kind. “We can understand what air you were breathing during certain periods of your life. We can understand what water you were probably drinking, what schools you were going to, where you were deployed if you were in the military.”
These reconstructed life histories are then linked with neuropathology, genomics, and imaging data. The result is a robust dataset connecting lived experience to biological outcomes, and CHDR scientists are drawing some sobering conclusions about the risks of social deprivation to brain health. For instance, childhood exposure to adverse environments increases the risk of cerebrovascular disease eight to twelvefold.
“These are exposures in your childhood writing your future 50 years from now,” says Kind.
These findings underscore the biological weight of disadvantage, she adds, and the potential impact of interventions that incorporate the Area Deprivation Index.
But while the Center for Health Disparities Research is already making an impact across the U.S., its reach is being supercharged by a partnership closer to home.
Where It’s Harder to Be Healthy
Verona, Wisconsin’s Epic Systems, founded by Judith Faulkner MS’67, is the nation’s largest provider of electronic health record software. Epic’s Cosmos dataset contains more than 300 million anonymized patient records, enabling insights into patient outcomes to improve care and advance medicine. Many organizations started participating in Cosmos during the COVID-19 pandemic, when the need for up-to-date data became more urgent.
The Area Deprivation Index has become a go-to resource for researchers, policymakers, and health care practitioners.
Cosmos has evolved into a powerful engine for rapid research and clinical pattern-finding, according to Jackie Gerhart ’04, Epic’s chief medical officer. Recognizing the importance of geography to health, Gerhart says Epic wanted to incorporate data that could help researchers identify patterns based on life circumstances.
“We realized that we had a couple of different ways to measure disparities, but the ADI work being done at UW was the most in-depth,” Gerhart says.
While that depth requires more data entry, it also translates into better insights. So far, ADI metrics have been incorporated into around 130 million patient records. Gerhart sees a future where the Area Deprivation Index reshapes how organizations spot and support patients whose needs extend beyond their visit to a clinic.
For Kind, it’s personal, given her roots in rural Niagara.
“When we look at Niagara on the ADI, it’s one of the most disadvantaged places in Wisconsin,” she says. “When I’m writing a research grant for the National Institutes of Health, I am thinking about towns like Niagara, where it’s harder to be healthy. It’s my mission as a professor at UW–Madison to advance research that improves their lives.”
Will Cushman MS’16 is a writer for the UW–Madison Office of Strategic Communication.
Published in the Spring 2026 issue


Comments
Bruce Larson March 13, 2026
Wow. What an inspiring article. It led me on an exciting search for related information which took me to the site for the Center for Health Disparities Research, ChatGPT, and The Exposome Project. The term ‘exposome’ somehow escaped my education, but now I’ve got it. Thanks for a transformative article.
Jacquelyn Dahlke March 24, 2026
This is a fabulous resource!
Tom Bray March 31, 2026
Looks intriguing!! I would like to check my neighborhood – how can I do it?
I’m 93, BSEE ’54, UW